Does this bearing alarm warrant an inspection?
If you’re responsible for keeping a plant running, an alarm after a pump changes speed leaves you with a hard call. Take it offline and you might stop a healthy machine. Wait and a worn bearing could fail on shift.
VesselSeed is a research project for reliability engineers and vibration analysts. We take a second look at the vibration recording and shaft speed a plant already collects. Can the timing of repeated impacts tell you something your usual review missed?
What we found. On a second lab dataset, the speed-adjusted baseline and VesselSeed each caught 14 of 15 fault recordings and flagged the same three healthy ones at matched detection. We’re looking for a past alarm where your usual review left you unsure.
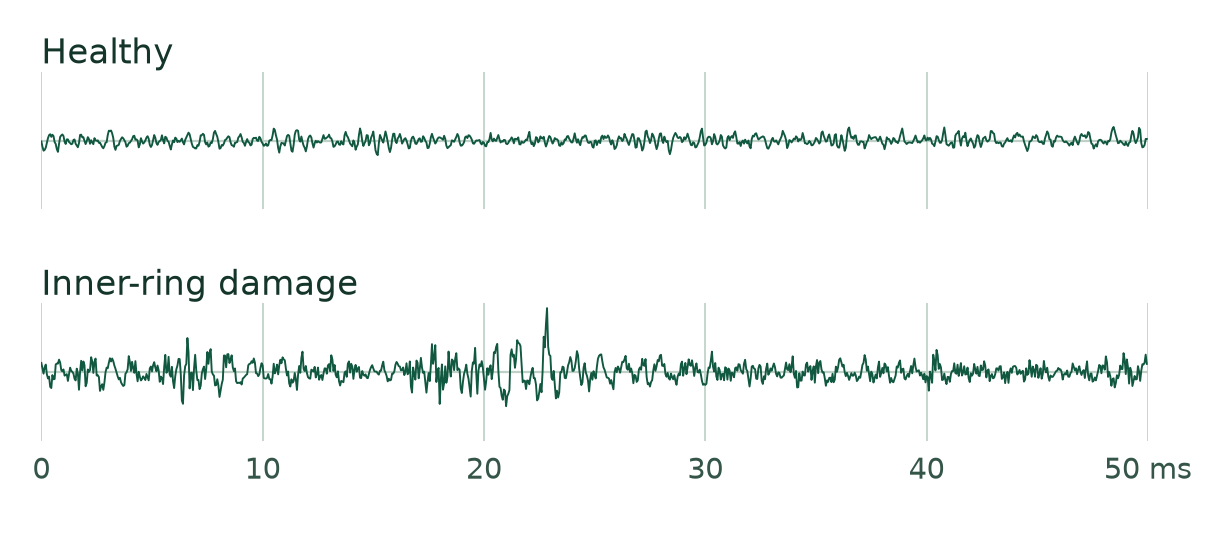
First accelerometer channel, centered, one shared amplitude scale. Adapted from Schnur et al. under CC BY 4.0.
Plants already collect the recordings we need to test this.
Why now?
Schaeffler and its service partner describe one manufacturer going from 50 sensors in one plant to more than 5,000 across several European plants by September 2023. Maintenance staff confirmed bearing damage on an exhaust motor after an alert. An installed monitoring system gives us a way to test a second opinion on past alarms before asking a plant to change how it operates. Deployment case study.
How big is the opportunity?
Grand View Research estimates the global vibration monitoring market at $1.9 billion in 2026. That includes equipment and services. Our potential buyers are the plant reliability teams and monitoring firms that review variable-speed pump and motor alarms and can check what inspection eventually found. Market estimate and scope.
Our U.S. base case is $6.21 million a year for reviews at manufacturing and wastewater plants. How many sites can supply the data, how often they need a review and what they will pay per case are assumptions.
What could VesselSeed add to today’s tools?
SKF’s order tracking lines up vibration with shaft rotation so a change of speed does not smear a fault across frequencies. Its enveloping tools help analysts find bearing impacts. Those are established ways to investigate an alarm. SKF order tracking · How SKF detects repetitive impacts.
Two recordings can both have energy at the expected defect frequency. Our question is whether the rhythm of those impacts can distinguish damage after accounting for speed. Across our first experiment and the independent dataset, adding phase information saved no false alarms at the same fault-detection rate. We would keep the existing workflow on this evidence.
How large is the U.S. market for a second opinion?
Start with two U.S. customer groups that operate pumps and motors. The 2022 Economic Census counted 286,626 manufacturing establishments. The EPA counted 17,544 publicly owned wastewater treatment works as of January 2022. We count sites once, including those served by monitoring contractors. A contractor serving ten eligible plants represents ten sites in this calculation. U.S. Census Bureau · EPA survey.
The base case assumes 3% of manufacturing sites and 10% of wastewater sites have relevant variable-speed equipment, exportable waveforms and speed records, and someone who can obtain inspection outcomes. That gives about 10,353 eligible sites. Assume four difficult cases per site per year at $150 each. The result is $6.21 million annually, about $5.16 million from manufacturing and $1.05 million from wastewater.
| Assumption | Low | Base | High |
|---|---|---|---|
| Eligible manufacturing sites | 1% | 3% | 7% |
| Eligible wastewater sites | 3% | 10% | 20% |
| Reviews per eligible site / year | 2 | 4 | 8 |
| Price per review | $75 | $150 | $250 |
| Annual spend | $0.51M | $6.21M | $47.15M |
The base case equals about 0.33% of the $1.9 billion global category as a scale comparison. The calculation uses the two U.S. site counts, with no extrapolation to other countries or industries. Halving either the case volume or the fee halves the result. Ten paying sites at the base price and volume would produce $6,000 a year. As a side project, eight analyst hours a week for 48 weeks at two hours per review would cap delivery at 192 cases or $28,800 a year before expenses, customer acquisition or idle time. These are capacity scenarios. We have yet to validate the site filters, price or purchase frequency with buyers. Download the calculation inputs.
On a second rig, the full grid added no correct calls.
We froze a bearing-specific implementation of the published grid method, calibrated it on 96 Saarland recordings and tested it on an independent dataset from Hanoi University of Science and Technology. The test used all 30 steady-speed healthy and isolated inner-race recordings, covering five bearing sizes and three motor loads. Each file counted once. HUST data, version 3 · Experiment and bearing dimensions.
| Method | Faults detected | Healthy recordings flagged |
|---|---|---|
| Speed-adjusted baseline | 14 / 15 | 3 / 15 |
| Baseline plus full grid | 14 / 15 | 3 / 15 |
| Same model, measured phase removed | 14 / 15 | 3 / 15 |
| Full grid alone | 14 / 15 | 14 / 15 |
All three baseline-based methods flagged the same three healthy 6205 recordings and missed the same 6207 fault at 200 W. Used alone, the grid flagged eleven more healthy recordings. Load settings repeat across bearings, so 30 recordings do not mean 30 independent machines.
What would have happened with the original alarm settings?
The table above uses test labels to match detection rates. When we kept the alarm thresholds set on Saarland, the baseline, combined model and phase-removed control each flagged all 30 Hanoi recordings. They caught all 15 faults and also alarmed on all 15 healthy recordings. The grid alone caught 14 faults and flagged all 15 healthy recordings. A plant could not have obtained the table’s lower false-alarm rate simply by installing those settings.
What “full grid” means in this test
Both methods received the same two seconds of one acceleration channel, shaft speed and bearing geometry. The baseline measured envelope energy near three speed-adjusted inner-ring harmonics. Our implementation mapped the waveform to 15 prime-frequency anchors on a 7 × 7 spiral, populated neighboring cells, iteratively updated phase and coherence, applied chirality and harmonic weights, selected peaks and converted them to an alarm score. All 30 grids reached the frozen convergence criterion. One produced no eligible prime peak.
The combined model used the baseline and grid score together. For the control, we zeroed measured phase offsets before building the grid and kept the combined model’s fitted weights. The standalone arm used only the grid score. The application describes multiple embodiments. The frozen protocol identifies the specific input mapping, update rule, readout and limits used here. The test concerns steady speeds and laboratory damage. Deployment during an actual speed change remains untested.
Per-recording scoresCounts and thresholdsFrozen protocolCode and reproduction kit
Our decision is to keep the existing speed-adjusted workflow. A new field trial would need a specific class of failures and blinded inspection outcomes that could justify revisiting this result. Read the earlier phase-only study.
Switching phase on saved zero false alarms in the first test.
Damage on a bearing’s inner ring can produce a pulse each time a roller crosses it. A conventional check looks for vibration energy around the expected repetition rate as speed changes. We asked whether the timing of those vibrations across short intervals could help an analyst dismiss healthy readings.
| Analysis | Faults detected | Healthy recordings flagged |
|---|---|---|
| Speed-adjusted baseline | 44 / 48 | 47 / 48 |
| Baseline with phase alignment | 44 / 48 | 46 / 48 |
| Same fitted model, phase switched off | 44 / 48 | 46 / 48 |
Each method missed four damaged recordings. Nearly every healthy recording triggered an alarm. The one-alarm improvement over the standalone baseline persisted with phase switched off. On this evidence, we would keep the analyst’s existing workflow.
Per-recording scores (CSV)Reproduce the study (ZIP)
Study design, thresholds and limits
We used 96 two-second recordings from three physical NU206 bearings, before and after artificial inner-ring damage. The subset covers four speed settings, two load settings, one bearing position and two runs. For each test recording, training excluded both that bearing and that speed setting. The dataset samples different speed settings. Changes in speed during a single field alarm remain an open question.
Each method received the same three-axis acceleration at 20 kHz and the measured shaft RPM. The baseline uses envelope power near the first three harmonics of the expected inner-ring defect frequency. The second model adds a phase-alignment score over eight intervals. For the phase-off row, we kept that model’s weights fixed and replaced the score with its training mean.
We matched detection rates retrospectively using held-out scores. With thresholds set using training data alone, the baseline and phase-on models each detected 36 of 48 damaged recordings and flagged 36 and 34 healthy recordings respectively. With phase off, the model detected 27 and flagged 36. With repeated recordings from just three bearings, this secondary result needs an independent test.
Dataset and rig by Christopher Schnur and colleagues at Saarland University. Source recordings · Experiment design
See how speed changes the signal.
In this synthetic signal, increasing shaft speed brings the pulses closer together. Keep speed fixed and increase pulse jitter to see what irregular timing does. Turn the defect impulse down to zero to see shaft vibration and noise alone.
Synthetic vibration
Illustration only. The simulated defect repeats 7.76 times per revolution. The measured results above come from the physical bearings.
What did we take from the invention?
Devin Bostick’s U.S. application Data Processing via Prime Coherence describes a method for finding patterns in a waveform. It stores frequency and phase information in a grid, updates each entry using its neighbors, and selects peaks using chirality, phase and harmonic relationships. The USPTO issued a notice of allowance for the amended claims on September 9, 2026.
The first bearing experiment borrowed the phase-alignment score in equations 4 and 5. The Hanoi test exercised the core waveform-to-grid-to-peaks method in a bearing-specific implementation. Neither test showed fewer false alarms from adding the proposed signal at matched detection.
Help test the next ambiguous alarm.
Have you inspected a pump because of a vibration alarm after a speed change? We’d like to hear from the engineer or analyst who had to make the call. Start with what the alarm showed and why the choice was difficult. Keep the inspection outcome private so we can test both methods blind.
Discuss a past alarm with Devindevin.bostick@paracosmventures.com
What we’d do with a field partner
- Start with the cases. A useful batch includes healthy and damaged machines, the original waveforms, speed and load information where available, and what inspection found. You hold back the inspection outcomes. Together we agree on the fault-detection target before either method sees the answers.
- Compare the calls. On held-out machines, run your usual review and our speed-adjusted method with phase on and off. Each records its call, time spent and any missing measurement before the outcomes are revealed.
- Decide whether to continue. Count false alarms at the same detection rate, missed faults and unresolved cases. Fewer healthy alarms sent for inspection at the agreed detection rate would justify a second batch. A tie or loss favors keeping your current workflow.
The lab comparison explains why we’re asking for difficult field cases. The U.S. market estimate shows what per-case reviews might be worth if they save inspections. See the existing tools and why now.